The roads I take...
KaiRo's weBlog
| Zeige Beiträge veröffentlicht im April 2014 und mit "Mozilla" gekennzeichnet an. Zurück zu allen aktuellen Beiträgen | |||||||||||||||||||||||||||||||||||||||||||
1. April 2014
How Effective is the Mozilla Stability Program?
One of my goals for last quarter was to get some basic metrics for the effectiveness of Mozilla's stability program. This can most easily be determined by measuring how often Firefox Desktop and Firefox for Android crash over time. Below you'll find some graphs and discussion on the data I could gather on that topic so far.
The Crash Rate
The crash rate is our primary stability measure used at Mozilla. We measure this rate in "crashes per 100 active daily installations (ADI)" or "crashes / 100 ADI". (ADI is the number of daily requests sent by Firefox Desktop and Firefox for Android to update their copy of our add-on blocklist. This value is considered a good enough estimation for usage for our purposes.)
Challenges for a Long-Term Rate
In our daily work, we tend to look at crash rates in terms of short-term changes within a single version, esp. development versions, so we can determine regressions and then dig deeper into what those are. For determining long-term program efficiency, it makes sense though to look at cross-version crash rates instead, so we know how our releases (or betas) improved. So it might make sense to look at all users on the release "channel", i.e. anyone using a stable release. On the other hand, we sometimes have leftover users of old and unsupported users producing a lot of crashes, but those are not really relevant to our current effectiveness of the stability program, so I wanted some way to age out old versions from this overall rate. To take all that into account, I needed some way to more or less "concatenate" the stability rate graphs of a series of versions. Also, people updating to or installing a release very soon after it's published tend to have somewhat different usage patterns than those installing it only after some time and therefore crash rates to those updating late in the cycle, so I needed to find some way to smoothen over that as well and ideally make this into an algorithm that can be automatically requested and put into an SQL query (as the data I base this on is in a PostgreSQL database).
Used Methodology
So, I began to think we could always sum up the crash and ADI numbers of the most recent two releases, or the ones that have the most users. But sometimes we release two adjacent versions 6 weeks apart and sometimes we do a fast update after a week and when the second of those is released, the one before might not have a lot of people updated to it yet so taking only those two might only cover a small portion of users and skew the numbers. So in the end, I decided to go with a moving window that always counts all versions where the builds have been created within the last 12 weeks for the Release channel, and the last 4 weeks for the Beta channel (I had 9 and 3 in the beginning but extended that to make numbers smooth over the impact of the 2-week hiatus we had over New Year's this year). The data we have in usable form goes back to the last few days of September 2011, so that's what I could use for the graphs (I'm trying to get some older data but that is harder to dig out).
Graphs & Discussion
So, here are some screen copies of the graphs I have created out of the data collected with that algorithm (includes data up to March 5, which was current when I originally wrote up this post):

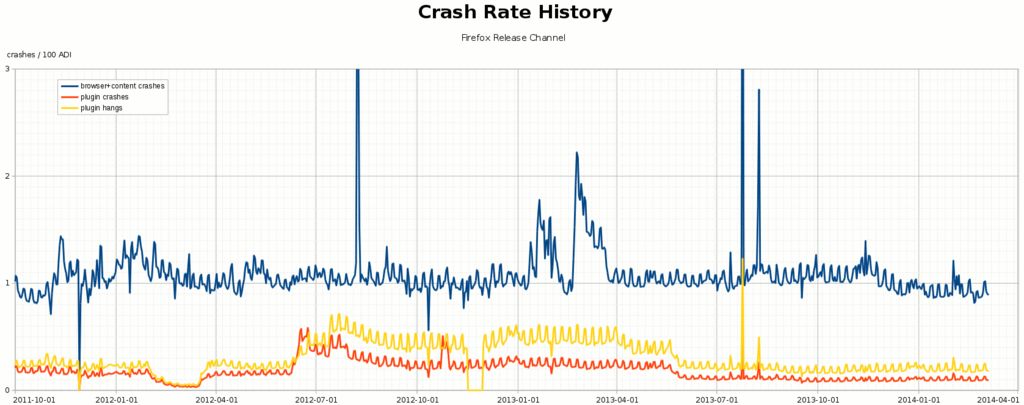
The first graph, with data from the Firefox desktop release channel, shows three lines, as the legend says the include crashes of the browser process, those of a plugin process (the vast majority of the plugin processes are Adobe Flash), and so-called "hangs" where we kill the plugin process after it doesn't react to contact from the browser process for a long time (by default, 45 seconds).
For one thing, you'll see that weekends have higher crash rates than weekdays. This could for example be because the ADI data isn't as reliable/accurate as one would hope or because people using Firefox on weekends do things that are more crash-prone (including work/home usage pattern and possibly machine differences).
In this graph we can also clearly see the results of known stability events in this time frame: For example, it nicely shows the Google Doodle crash of August 2012, where almost every startup of the browser crashed when Google was set as the home page, and where we scrambled to get a fix out in very short time (and Google helped us by putting a workaround in their doodles as well). It's also easy to see a few other sharp spikes where we had ADI (upwards) or crash submission (downwards) issues, as well as the crash-and-hang-rich Flash 11.3 release in June of 2012 and subsequent fixes for Flash, including the concerted efforts between Adobe and us to get down to the old levels with fixes on both sides in May/June 2013. For the most time on the graph, you'll see that the browser crash rate didn't change very much (other than the sharp spikes mentioned). In January of 2013, though, it's possible to see the rise in crashes that caused us to ship Firefox 18.0.2 with a fix for that. Right following that, at the end of February, you'll see the sharp rise in crashes when we released Firefox 19.0, triggered by a bug in certain AMD CPUs, which we worked around by rebuilding and releasing a 19.0.1. Those examples, like anything showing up in that graph significantly and not being a data error has pretty intricate story, any of those could make up a separate blog post.
That said, the fact that we could keep the crash rate pretty much at 1.0 browser crashes / 100 ADI over that whole time (and even slightly improve to just below that with the Firefox 26 release in December 2013) is a statement on how effective the Mozilla Stability Program is on keeping Firefox crashes down even though a whole lot of code has been added to support a ton of new features that the web has gained over that time.
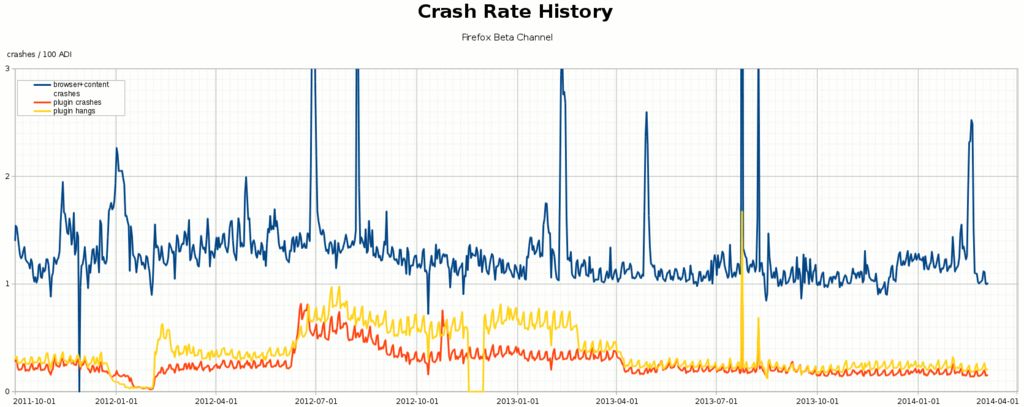
Now, let's see how Firefox Beta looks in comparison:

At the end of 2012, we apparently did manage to improve base level stability of the Beta channel, but you'll see that this channel is more noisy - which is expected as here we still see regressions and work on fixes before the issues hit release. For example, you can see that Firefox 27 Beta regressed stability in December 2013. We fixed that only very late in the cycle so that you don't see 27 being worse on the Release channel, but 28 had other regressions in the beginning and a rather large one in 28 Beta 4 (mid February 2014) - once we fixed that, you see that we come down to the 1.0 line in the last one or two weeks, so that looks pretty good for the 28 release, which was to be released ~2 weeks after the end of that data.
Also, you'll see that the plugin improvements of early 2013 are about 6 weeks earlier in Beta than in Release, which shows pretty well that there were actual patches in our code that helped with Flash hangs and crashes (as our code is on a 6-week cadence while Adobe's releases hit both channels pretty much at the same time).
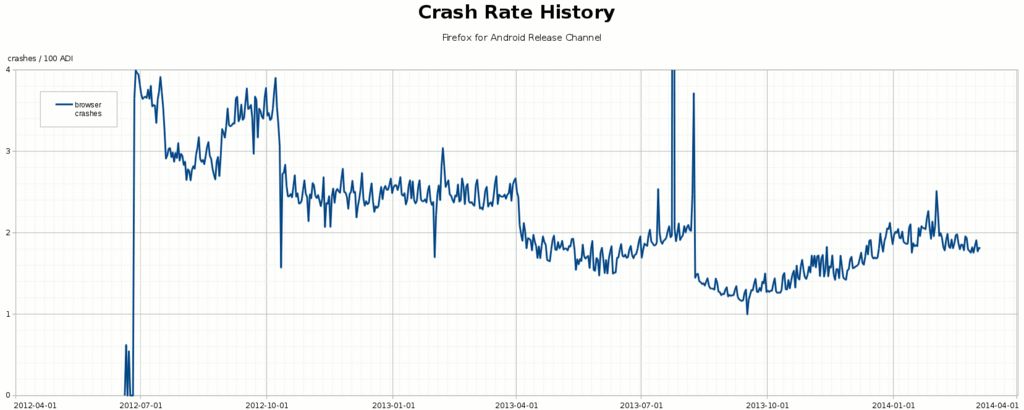
Now, let's see how the picture looks when we look at a product that was newly created while we already had the mechanisms in place to record this data, like the current "native UI" Firefox for Android:

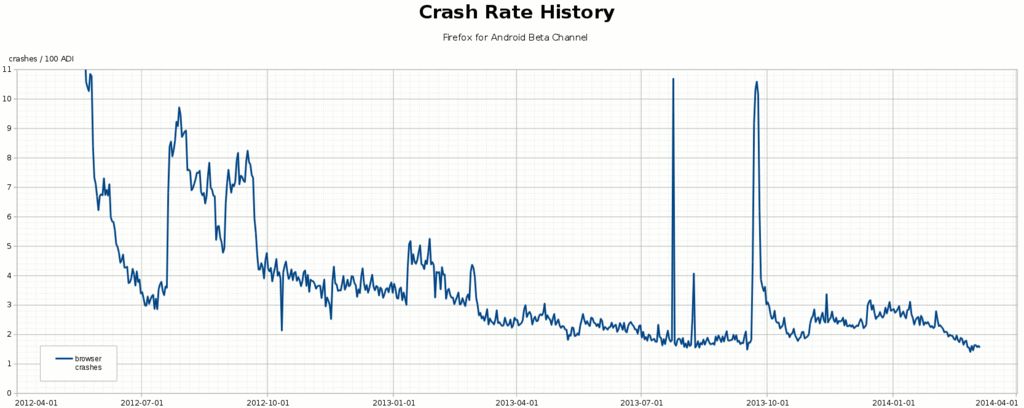
The early releases had higher crash rates, but we significantly improved over time due to our efforts in the Stability Program. You also can make out that the sharper changes happen pretty exactly at the edges of the 6-week release cycles. Also, you'll see that Firefox 23 for Android in September 2013 was pretty good but we became worse in the following months. Because of that, we started a renewed effort to improve stability of Firefox for Android this January. The current Firefox 27 for Android release is somewhat better than the one before, but it's not where we want to be yet, obviously. We didn't have too much time to pound on issues from the start of the year until 27 was release, but Beta can show us if our newer efforts are pointing in the right direction:

Now this graph looks pretty nice, doesn't it? When we started off putting this product on Beta the first time, we were seeing the usual churn of exposing a new product to a wider audience for the first time, but we burned down the issues pretty well. Then we had a big regression, fixed it, and burned down bugs slowly over multiple months again. The regressions of late 2013 look even more dramatic here as we had even worse issues there but could actually fix the worst parts of those so that the regressions on the Release channel weren't as bad as the first Betas we had there. Many of the 6-week cycles in this graph look like burn-down charts, high in the beginning, going down over the cycle as we push for bugs being fixed. It's also pretty awesome to see how the efforts since the start of this year have really paid off and current Beta is rivaling the best Beta numbers we had so far - you can imagine how I was looking forward to Firefox 28 for Android hitting Release based on that data!
All that said, we know there's more we can do on both products, and while holding crash rates pretty stable over a long time while adding a ton of features is awesome, we strive for improving overall stability. Those graphs are one part of measuring the effectiveness of the stability program. I hope we will be able to put them up in a more dynamic and daily updating form at some point (right now I manually construct them in LibreOffice).
And in case you're interested in digging deeper into the source of the graphs, the code to pull the data from the crash-stats DB is in my crash-report-tools repo and the JSON coming out of that and powering my charts is in my directory on crash-analysis (F*-bytype.json files). Also feel free to contact me for more details.
The Crash Rate
The crash rate is our primary stability measure used at Mozilla. We measure this rate in "crashes per 100 active daily installations (ADI)" or "crashes / 100 ADI". (ADI is the number of daily requests sent by Firefox Desktop and Firefox for Android to update their copy of our add-on blocklist. This value is considered a good enough estimation for usage for our purposes.)
Challenges for a Long-Term Rate
In our daily work, we tend to look at crash rates in terms of short-term changes within a single version, esp. development versions, so we can determine regressions and then dig deeper into what those are. For determining long-term program efficiency, it makes sense though to look at cross-version crash rates instead, so we know how our releases (or betas) improved. So it might make sense to look at all users on the release "channel", i.e. anyone using a stable release. On the other hand, we sometimes have leftover users of old and unsupported users producing a lot of crashes, but those are not really relevant to our current effectiveness of the stability program, so I wanted some way to age out old versions from this overall rate. To take all that into account, I needed some way to more or less "concatenate" the stability rate graphs of a series of versions. Also, people updating to or installing a release very soon after it's published tend to have somewhat different usage patterns than those installing it only after some time and therefore crash rates to those updating late in the cycle, so I needed to find some way to smoothen over that as well and ideally make this into an algorithm that can be automatically requested and put into an SQL query (as the data I base this on is in a PostgreSQL database).
Used Methodology
So, I began to think we could always sum up the crash and ADI numbers of the most recent two releases, or the ones that have the most users. But sometimes we release two adjacent versions 6 weeks apart and sometimes we do a fast update after a week and when the second of those is released, the one before might not have a lot of people updated to it yet so taking only those two might only cover a small portion of users and skew the numbers. So in the end, I decided to go with a moving window that always counts all versions where the builds have been created within the last 12 weeks for the Release channel, and the last 4 weeks for the Beta channel (I had 9 and 3 in the beginning but extended that to make numbers smooth over the impact of the 2-week hiatus we had over New Year's this year). The data we have in usable form goes back to the last few days of September 2011, so that's what I could use for the graphs (I'm trying to get some older data but that is harder to dig out).
Graphs & Discussion
So, here are some screen copies of the graphs I have created out of the data collected with that algorithm (includes data up to March 5, which was current when I originally wrote up this post):
The first graph, with data from the Firefox desktop release channel, shows three lines, as the legend says the include crashes of the browser process, those of a plugin process (the vast majority of the plugin processes are Adobe Flash), and so-called "hangs" where we kill the plugin process after it doesn't react to contact from the browser process for a long time (by default, 45 seconds).
For one thing, you'll see that weekends have higher crash rates than weekdays. This could for example be because the ADI data isn't as reliable/accurate as one would hope or because people using Firefox on weekends do things that are more crash-prone (including work/home usage pattern and possibly machine differences).
In this graph we can also clearly see the results of known stability events in this time frame: For example, it nicely shows the Google Doodle crash of August 2012, where almost every startup of the browser crashed when Google was set as the home page, and where we scrambled to get a fix out in very short time (and Google helped us by putting a workaround in their doodles as well). It's also easy to see a few other sharp spikes where we had ADI (upwards) or crash submission (downwards) issues, as well as the crash-and-hang-rich Flash 11.3 release in June of 2012 and subsequent fixes for Flash, including the concerted efforts between Adobe and us to get down to the old levels with fixes on both sides in May/June 2013. For the most time on the graph, you'll see that the browser crash rate didn't change very much (other than the sharp spikes mentioned). In January of 2013, though, it's possible to see the rise in crashes that caused us to ship Firefox 18.0.2 with a fix for that. Right following that, at the end of February, you'll see the sharp rise in crashes when we released Firefox 19.0, triggered by a bug in certain AMD CPUs, which we worked around by rebuilding and releasing a 19.0.1. Those examples, like anything showing up in that graph significantly and not being a data error has pretty intricate story, any of those could make up a separate blog post.
That said, the fact that we could keep the crash rate pretty much at 1.0 browser crashes / 100 ADI over that whole time (and even slightly improve to just below that with the Firefox 26 release in December 2013) is a statement on how effective the Mozilla Stability Program is on keeping Firefox crashes down even though a whole lot of code has been added to support a ton of new features that the web has gained over that time.
Now, let's see how Firefox Beta looks in comparison:
At the end of 2012, we apparently did manage to improve base level stability of the Beta channel, but you'll see that this channel is more noisy - which is expected as here we still see regressions and work on fixes before the issues hit release. For example, you can see that Firefox 27 Beta regressed stability in December 2013. We fixed that only very late in the cycle so that you don't see 27 being worse on the Release channel, but 28 had other regressions in the beginning and a rather large one in 28 Beta 4 (mid February 2014) - once we fixed that, you see that we come down to the 1.0 line in the last one or two weeks, so that looks pretty good for the 28 release, which was to be released ~2 weeks after the end of that data.
Also, you'll see that the plugin improvements of early 2013 are about 6 weeks earlier in Beta than in Release, which shows pretty well that there were actual patches in our code that helped with Flash hangs and crashes (as our code is on a 6-week cadence while Adobe's releases hit both channels pretty much at the same time).
Now, let's see how the picture looks when we look at a product that was newly created while we already had the mechanisms in place to record this data, like the current "native UI" Firefox for Android:
The early releases had higher crash rates, but we significantly improved over time due to our efforts in the Stability Program. You also can make out that the sharper changes happen pretty exactly at the edges of the 6-week release cycles. Also, you'll see that Firefox 23 for Android in September 2013 was pretty good but we became worse in the following months. Because of that, we started a renewed effort to improve stability of Firefox for Android this January. The current Firefox 27 for Android release is somewhat better than the one before, but it's not where we want to be yet, obviously. We didn't have too much time to pound on issues from the start of the year until 27 was release, but Beta can show us if our newer efforts are pointing in the right direction:
Now this graph looks pretty nice, doesn't it? When we started off putting this product on Beta the first time, we were seeing the usual churn of exposing a new product to a wider audience for the first time, but we burned down the issues pretty well. Then we had a big regression, fixed it, and burned down bugs slowly over multiple months again. The regressions of late 2013 look even more dramatic here as we had even worse issues there but could actually fix the worst parts of those so that the regressions on the Release channel weren't as bad as the first Betas we had there. Many of the 6-week cycles in this graph look like burn-down charts, high in the beginning, going down over the cycle as we push for bugs being fixed. It's also pretty awesome to see how the efforts since the start of this year have really paid off and current Beta is rivaling the best Beta numbers we had so far - you can imagine how I was looking forward to Firefox 28 for Android hitting Release based on that data!
All that said, we know there's more we can do on both products, and while holding crash rates pretty stable over a long time while adding a ton of features is awesome, we strive for improving overall stability. Those graphs are one part of measuring the effectiveness of the stability program. I hope we will be able to put them up in a more dynamic and daily updating form at some point (right now I manually construct them in LibreOffice).
And in case you're interested in digging deeper into the source of the graphs, the code to pull the data from the crash-stats DB is in my crash-report-tools repo and the JSON coming out of that and powering my charts is in my directory on crash-analysis (F*-bytype.json files). Also feel free to contact me for more details.
Von KaiRo, um 19:58 | Tags: CrashKill, Mozilla, stability | 1 Kommentar | TrackBack: 0
