<< Weekly Status Report, W30/2011 | The roads I take... | 47 >>
Crash-stats Update, Planned Changes, And Crash Rates
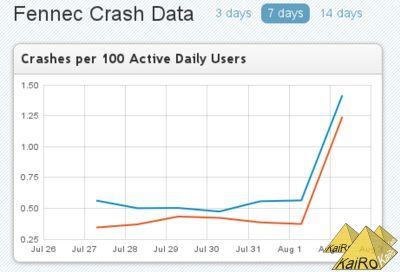
Those people who monitor the front page of the Mozilla crash stats website probably have noted a significant change today. If you are usually looking at Fennec stats there and therefore have saved a cookie that points you to Fennec by default, the graph there looks something like this today:

Now, did released "stable" and beta versions of Firefox Mobile suddenly become almost 3 times as crashy within a day?
Thankfully not. The data on the graphs actually was undercounting crashes until the newest set.
Last night, the Socorro team released their newest release, 2.1, to our production servers. That didn't just mean that colors on more detailed graphs are fixed and that source code should be linked correctly even for aurora and beta trees, it most of all means that crash counts now include all actual reports, for Fennec that is very significant, as crashes in content (website) processes have not been counted so far.
So, starting with the August 2 numbers (no old numbers are being backfilled), the system actually counts and displays crashes in websites in Fennec numbers and rates - and as we encounter almost double the amount of crashes in content processes than in browser processes on mobile, the total numbers seem to roughly triple.
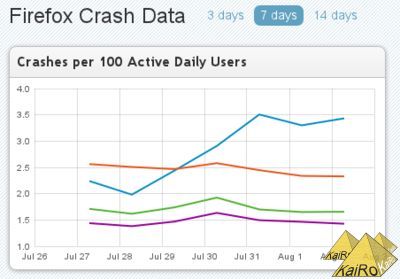
This also means that the reported rates for Fennec are in the same general area as the Firefox desktop numbers - at least they match what was listed for them until yesterday. People who have been watching those numbers might recognize a change in this graph as well:

And I mean neither that the blue line for Nightly is very high due to some recent regressions that our developers are working on, nor that Aurora (orange) is visibly going down after we fixed a prominent Flash hang (but more work is needed on crashes there), nor that Beta (green, the Flash hang fix not yet being visible) and Release show slightly higher rates on the weekend (Jul 30/31). Those are all normal mechanics.
I mean that numbers there for all days and versions looked somewhat lower yesterday than they do today. Beta and Release were almost identical before, slightly below that 1.5 line, and now they're distinct and mostly over that line.
As I hinted above, this is due to including *all* reports now, and due to a difference with mobile. And it's not content processes, which we don't have on desktop - but websites are still crashing mostly the same. It's data we have counted before (that's why it affects previous days as well) but not displayed in graphs: plugin crashes.
Fennec right now doesn't support plugins, so the 0.4-0.5 "crashes per 100 ADU" we see on Firefox desktop releases, mostly from Flash, but also other plugins, probably some even crashes in our plugin process that are not the plugins themselves, are missing out there, and that explains the remaining difference in rates between Fennec and Firefox. It also explains why graphs changed across the board today.
But the team is already working on more changes to come very soon:
Right now all builds with the same version number are lumped together in the same graphs and topcrash reports - but in the future, we need to tell apart different Beta builds so we can see if one beta is better than the previous one. We also need to be able to tell apart a release build on the beta and release channels, as the people on those channels have different usage habits, and even more importantly, we throttle crash reports on the release channel (we only process and therefore count 10% of the reports, actually, to not overwhelm server storage) but not on beta, which made crash rate calculations be quite useless around the last release. Because of that, the team is working hard to get this work done before we go for the next release on August 16, and then we should have useful numbers this time around.
This will also mean that we will have distinct numbers for every beta in the next cycle, which will be very helpful but probably will have its own fun repercussions - I should blog about that when this comes around.
I'd like to close out this post with some words of general caution when looking at crash rates or numbers: Never take them as a general stability measure without monitoring more closely what's behind them and why they look like they do!
Those rates lump together all kinds of issues:
If you look at this list, it becomes pretty clear that using those numbers as a firm measure of how stable a release or version is probably is not a really fair value. Still, the numbers are quite helpful in discovering if there is some kind of regression or new issue, if there is a good or bad trend, if some fix for a large issue has an overall effect - but following that discovery, we need to look closely at what the discovered issue really is and how we need to deal with it - that can be getting our developers to look into it, contacting third parties to work on a fix, blocking some add-on or library, advising release drivers of problems to track, etc. - and that's what's actually the job the CrashKill team, including myself, ends up doing most of the day.
Now, did released "stable" and beta versions of Firefox Mobile suddenly become almost 3 times as crashy within a day?
Thankfully not. The data on the graphs actually was undercounting crashes until the newest set.
Last night, the Socorro team released their newest release, 2.1, to our production servers. That didn't just mean that colors on more detailed graphs are fixed and that source code should be linked correctly even for aurora and beta trees, it most of all means that crash counts now include all actual reports, for Fennec that is very significant, as crashes in content (website) processes have not been counted so far.
So, starting with the August 2 numbers (no old numbers are being backfilled), the system actually counts and displays crashes in websites in Fennec numbers and rates - and as we encounter almost double the amount of crashes in content processes than in browser processes on mobile, the total numbers seem to roughly triple.
This also means that the reported rates for Fennec are in the same general area as the Firefox desktop numbers - at least they match what was listed for them until yesterday. People who have been watching those numbers might recognize a change in this graph as well:
And I mean neither that the blue line for Nightly is very high due to some recent regressions that our developers are working on, nor that Aurora (orange) is visibly going down after we fixed a prominent Flash hang (but more work is needed on crashes there), nor that Beta (green, the Flash hang fix not yet being visible) and Release show slightly higher rates on the weekend (Jul 30/31). Those are all normal mechanics.
I mean that numbers there for all days and versions looked somewhat lower yesterday than they do today. Beta and Release were almost identical before, slightly below that 1.5 line, and now they're distinct and mostly over that line.
As I hinted above, this is due to including *all* reports now, and due to a difference with mobile. And it's not content processes, which we don't have on desktop - but websites are still crashing mostly the same. It's data we have counted before (that's why it affects previous days as well) but not displayed in graphs: plugin crashes.
Fennec right now doesn't support plugins, so the 0.4-0.5 "crashes per 100 ADU" we see on Firefox desktop releases, mostly from Flash, but also other plugins, probably some even crashes in our plugin process that are not the plugins themselves, are missing out there, and that explains the remaining difference in rates between Fennec and Firefox. It also explains why graphs changed across the board today.
But the team is already working on more changes to come very soon:
Right now all builds with the same version number are lumped together in the same graphs and topcrash reports - but in the future, we need to tell apart different Beta builds so we can see if one beta is better than the previous one. We also need to be able to tell apart a release build on the beta and release channels, as the people on those channels have different usage habits, and even more importantly, we throttle crash reports on the release channel (we only process and therefore count 10% of the reports, actually, to not overwhelm server storage) but not on beta, which made crash rate calculations be quite useless around the last release. Because of that, the team is working hard to get this work done before we go for the next release on August 16, and then we should have useful numbers this time around.
This will also mean that we will have distinct numbers for every beta in the next cycle, which will be very helpful but probably will have its own fun repercussions - I should blog about that when this comes around.
I'd like to close out this post with some words of general caution when looking at crash rates or numbers: Never take them as a general stability measure without monitoring more closely what's behind them and why they look like they do!
Those rates lump together all kinds of issues:
- Regressions in our code that cause crashes,
- a long tail of residual crash issues in our code,
- binary libraries of valid third-party software or adware/malware hooking into our code and causing crashes due to incompatibilities, often because they're crafted for peculiarities of some other Firefox version,
- security tools like e.g. Norton Site Advisor or AVG not knowing that particular Firefox version and causing crashes by blocking it,
- add-ons with crashy code or incompatibilities,
- operating system or driver libraries that we call ending up crashing or showing incompatibilities with our code,
- out of memory issues,
- plugins (often Flash) crashing or not reacting in time (hanging), sometimes even crashing the browser process,
- website changes or new websites uncovering lingering crash issues (often from the long tail of residual crashes),
- and probably some more.
If you look at this list, it becomes pretty clear that using those numbers as a firm measure of how stable a release or version is probably is not a really fair value. Still, the numbers are quite helpful in discovering if there is some kind of regression or new issue, if there is a good or bad trend, if some fix for a large issue has an overall effect - but following that discovery, we need to look closely at what the discovered issue really is and how we need to deal with it - that can be getting our developers to look into it, contacting third parties to work on a fix, blocking some add-on or library, advising release drivers of problems to track, etc. - and that's what's actually the job the CrashKill team, including myself, ends up doing most of the day.
Beitrag geschrieben von KaiRo und gepostet am 3. August 2011 18:32 | Tags: CrashKill, Mozilla, Socorro | keine Kommentare
TrackBack/Pingback
Kommentare
Keine Kommentare gefunden.
